


Were we lied to by the world map on the classroom wall? Not exactly. Every flat map of the Earth distorts something, because a sphere cannot be flattened without stretching or tearing it. The familiar Mercator projection keeps angles and shapes correct for navigation, but in exchange it wildly inflates the size of places far from the equator.
That is why Greenland looks as big as Africa when Africa is about 14 times larger. Nobody hid the truth: cartographers have written about these trade-offs for centuries. This guide explains how map projections work, what the true size of countries really is, and which world maps give you a fairer picture before you plan your next trip.
Why Every Flat World Map Is Distorted
Try peeling an orange and pressing the peel flat on a table. It splits, bunches up or stretches. Mapmakers face the same problem with the Earth. In 1827 the mathematician Carl Friedrich Gauss proved, in a result known as the Theorema Egregium, that a curved surface like a sphere cannot be laid flat without changing distances somewhere.
A map projection is the mathematical rule used to move points from the globe onto a flat sheet. Each projection chooses what to protect and what to sacrifice. The four main properties are:
- Shape (conformal): small areas keep their correct shape and angles.
- Area (equal-area): every region keeps its correct size relative to others.
- Distance (equidistant): distances are true along certain lines or from one point.
- Direction: bearings between points are shown correctly.
No projection can keep all four at once. A map can be conformal or equal-area, but never both. So the real question is not whether a map is wrong, but whether it is the right tool for the job.
The Mercator Projection: Built for Sailors, Not Classrooms
The Flemish cartographer Gerardus Mercator published his world map in 1569, with a title that described it as corrected for the use of sailors. Its great advantage is that a line of constant compass bearing appears as a straight line. A navigator could draw a straight course between two ports, read off the angle and follow it.
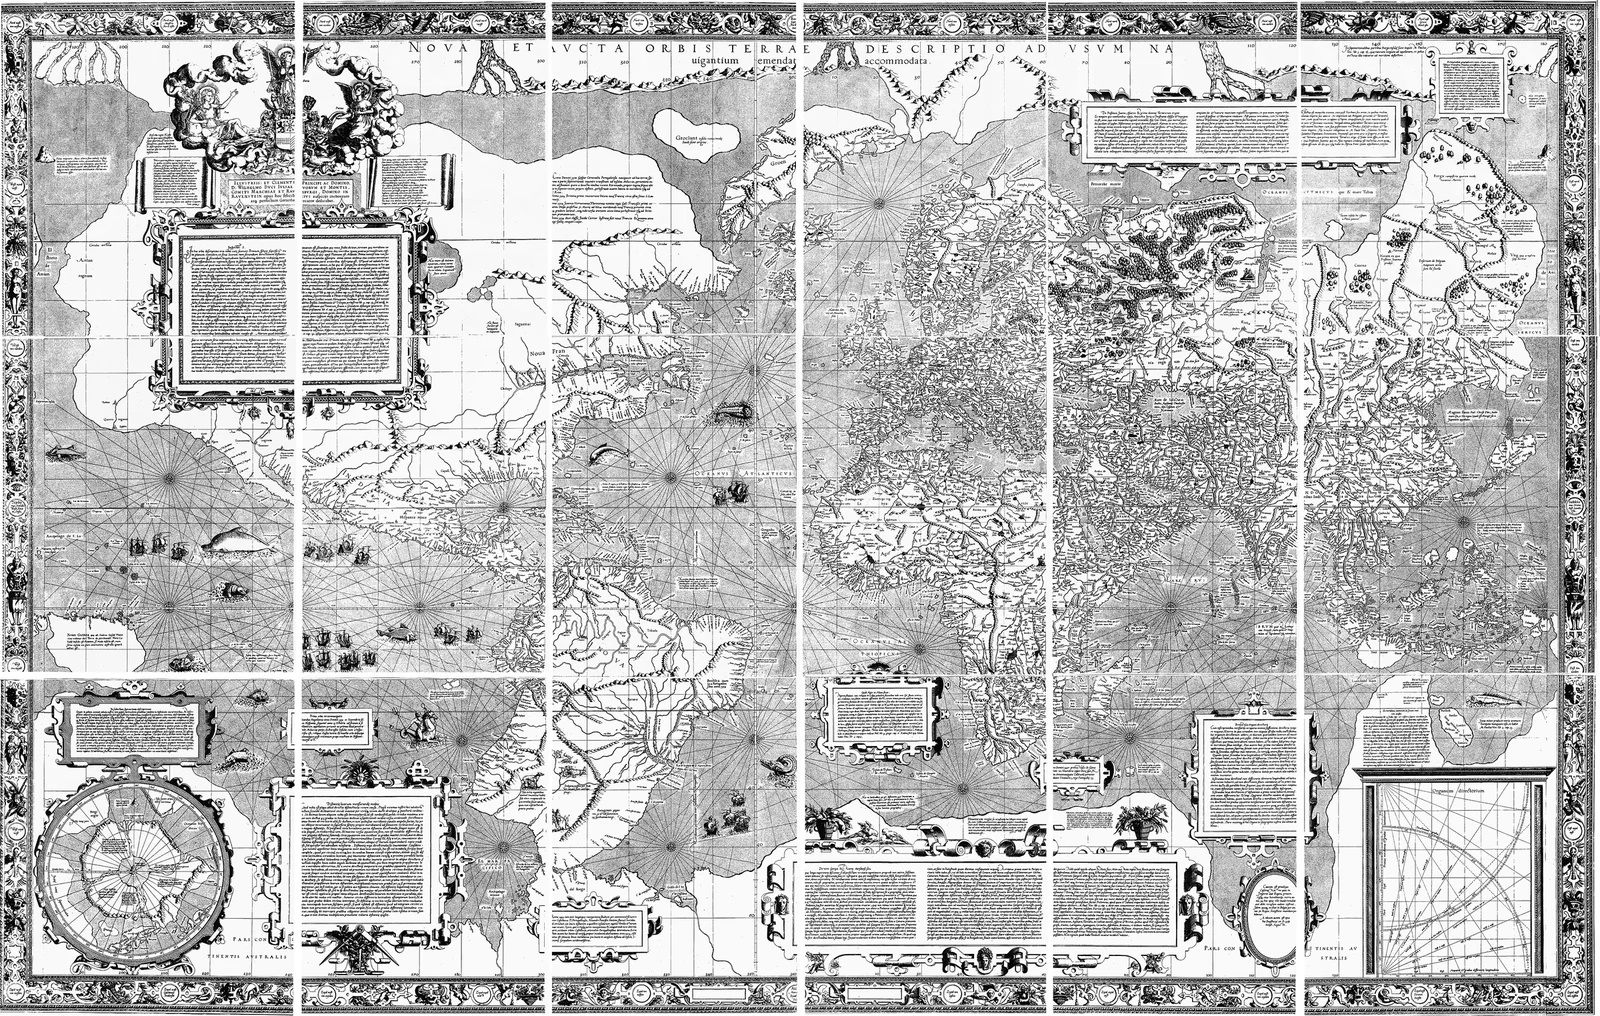
To keep angles true, Mercator stretched the map vertically as well as horizontally the farther it moves from the equator. The linear scale grows with the secant of the latitude: at 60 degrees north or south, lengths are doubled and areas appear four times larger than at the equator. At 85 degrees, lengths are stretched about 11.5 times, and the poles themselves can never be shown because the scale becomes infinite.
As the U.S. Geological Survey puts it, the Mercator is the only map on which a straight line shows a true direction, but distances and areas near the polar regions are grossly distorted. It was never meant to be a picture of how big countries are.
The True Size of Countries: Greenland, Africa and Russia
The easiest way to see Mercator distortion is to compare regions at different latitudes. High-latitude places such as Greenland, Canada, Russia, Alaska, Scandinavia and Antarctica look far bigger than they are, while countries near the equator look smaller.
| Comparison | How it looks on Mercator | Real area |
|---|---|---|
| Greenland vs Africa | About the same size | Greenland about 2.17 million km²; Africa about 30.4 million km², roughly 14 times larger |
| Alaska vs Australia | Similar in size | Alaska is about one quarter the size of Australia |
| Russia vs Africa | Russia looks much larger | Russia about 17.1 million km², under 60 percent of Africa |
| Antarctica | A huge band across the bottom | About 14 million km², smaller than Asia, Africa or the Americas |
The true size of Africa
Because it straddles the equator, Africa is the continent Mercator shrinks the most relative to the others. Its real area is roughly 30 million square kilometers. A widely shared graphic showed that the United States, China, India and Japan, plus much of Europe, fit inside Africa’s outline. If you are curious about the continent’s scale on the ground, our guide to the Sahara Desert covers a desert that alone is nearly as large as the United States.
Greenland: big, but not that big
Greenland is still the world’s largest island, at about 2.17 million square kilometers, most of it under an ice sheet. On a Mercator map it can look larger than South America, which is actually about eight times bigger. Our journey through Greenland’s glaciers shows what that landscape looks like up close.
Russia vs Pluto: a popular claim, corrected
You may have read that Russia is bigger than Pluto. It is close, but not quite. Russia covers about 17.1 million square kilometers, while Pluto, with a radius of about 1,188 kilometers measured by NASA’s New Horizons mission, has a surface area of roughly 17.7 million square kilometers. The comparison is still a striking reminder of Russia’s size, even without Mercator’s help.
Better World Map Projections to Know
Cartographers have designed hundreds of alternatives. None is perfect, but several are better suited to showing the whole world at once.
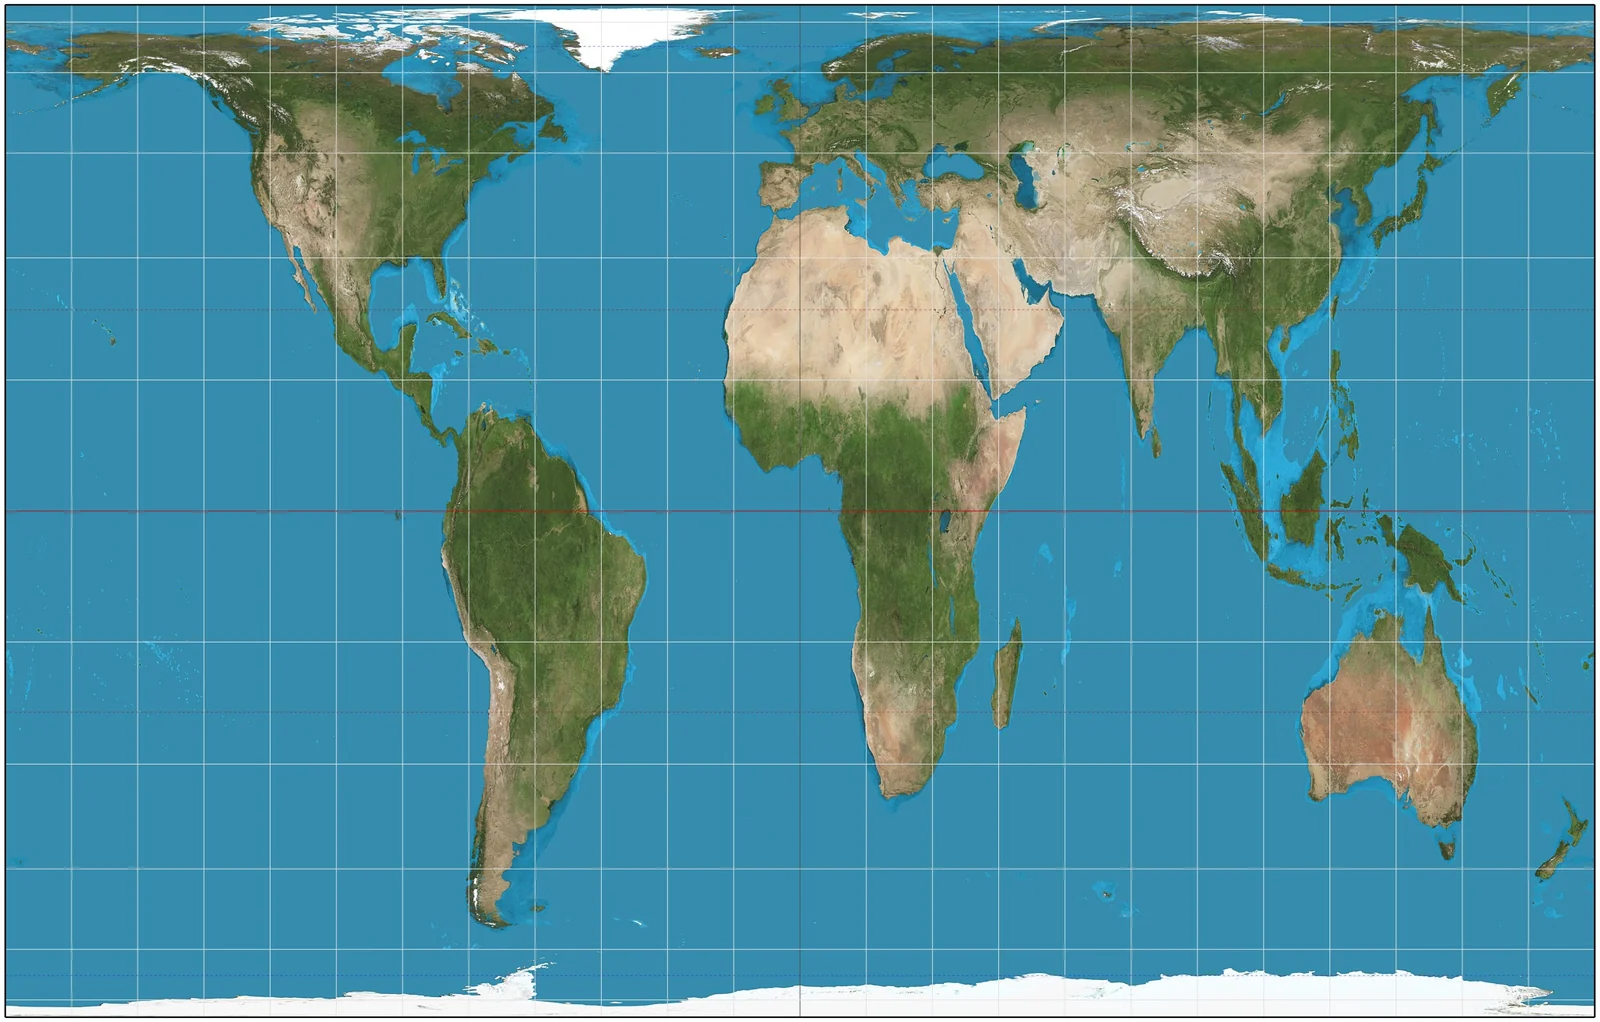
Gall–Peters projection
First described by James Gall in 1855 and promoted by the German historian Arno Peters from 1973, this equal-area map shows every country at its correct relative size. The price is shape: Africa and South America look long and narrow. In 2017 Boston Public Schools adopted it for classrooms to counter the Mercator bias, which reopened an old debate among mapmakers.
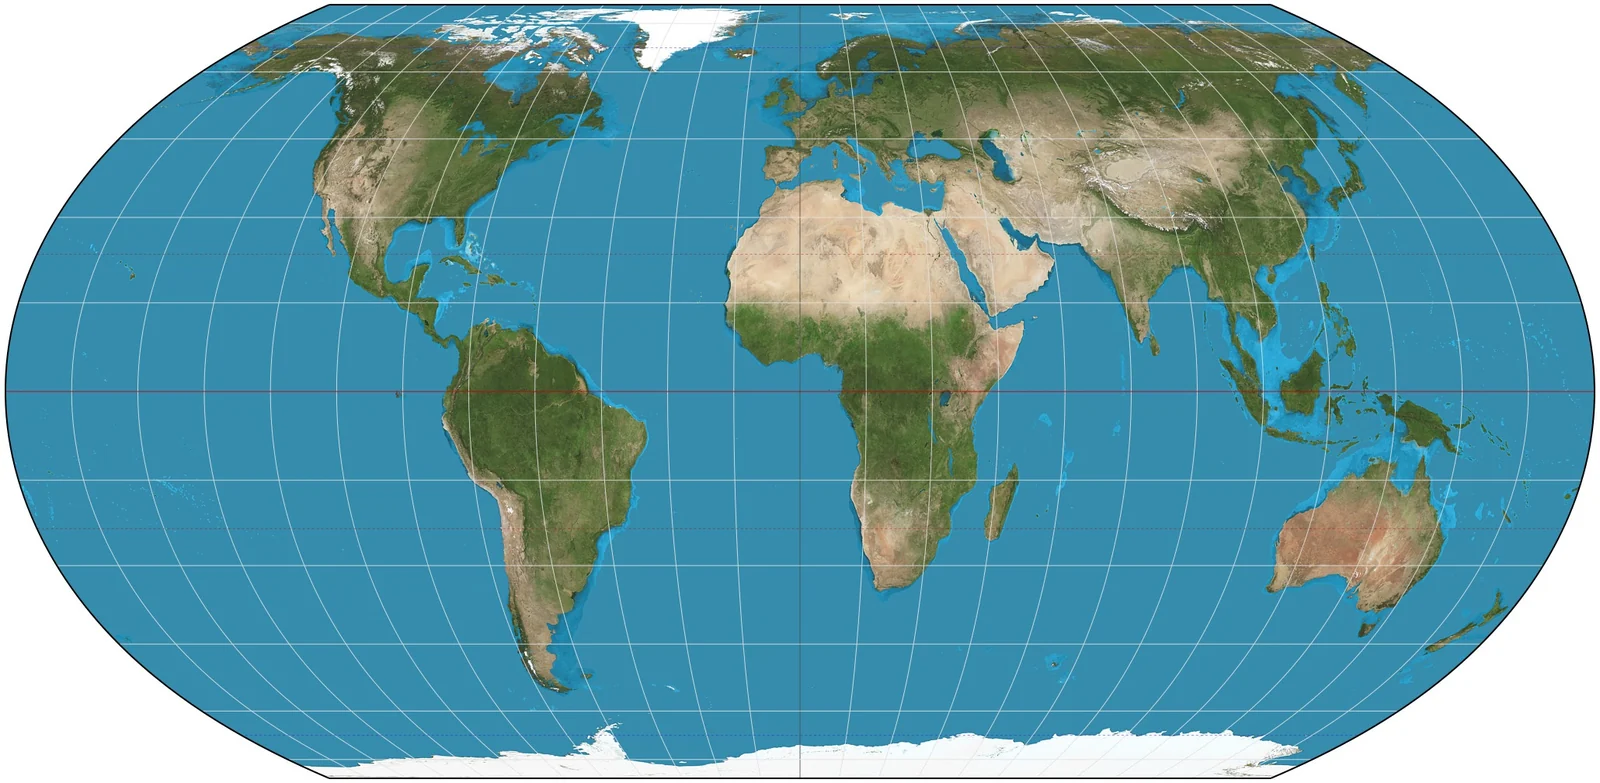
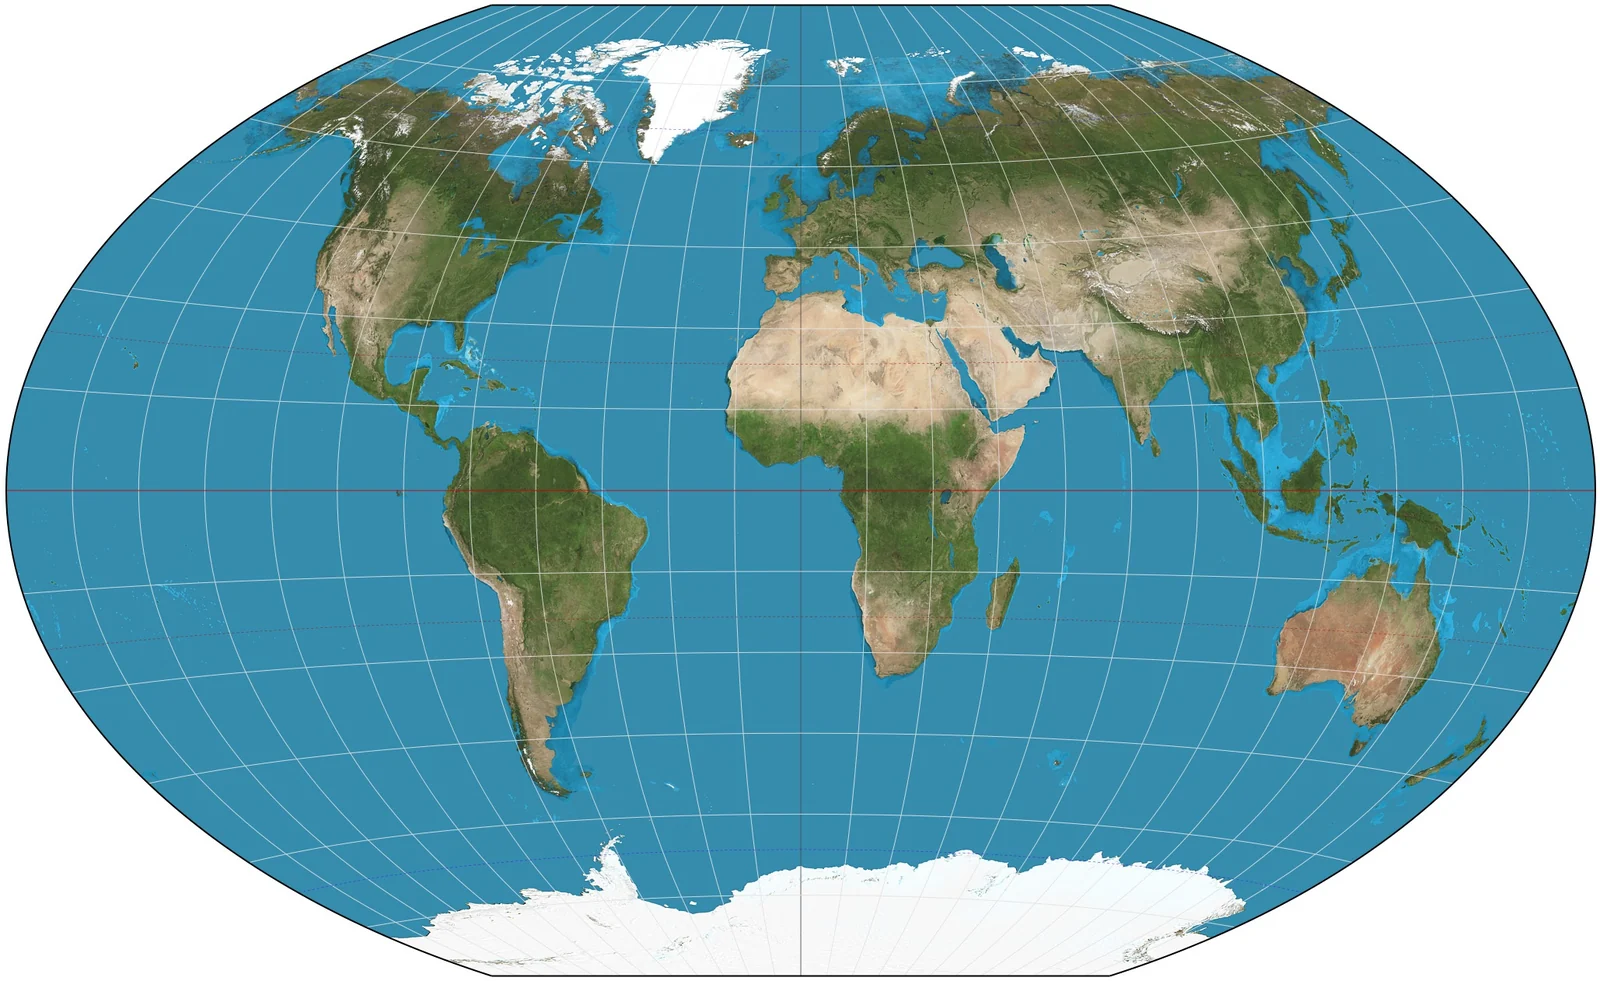
Robinson and Winkel tripel
These are compromise projections that are neither conformal nor equal-area but keep all errors moderate. The National Geographic Society used the Robinson projection for its world maps from 1988 and switched to the Winkel tripel, designed by Oswald Winkel in 1921, in 1998.
Equal Earth
Published in 2018 by Bojan Šavrič, Tom Patterson and Bernhard Jenny, the Equal Earth projection keeps true relative areas while looking much like the Robinson map. It was created partly in response to the Gall–Peters debate and was quickly adopted by NASA’s Goddard Institute for Space Studies.
AuthaGraph and the humble globe
The Japanese architect Hajime Narukawa’s AuthaGraph map divides the sphere into sections and unfolds them into a rectangle with very little area distortion, and it won Japan’s Good Design Grand Award in 2016. Still, the only truly undistorted world map is a globe.
Why Google Maps and Web Maps Still Use Mercator
If Mercator is so misleading, why do Google Maps, Bing Maps and OpenStreetMap use a version of it called Web Mercator? Because at street level, shape matters more than global area. A conformal map keeps intersections at right angles and buildings square at every zoom level, and the square tiles fit together seamlessly as you zoom in and out.
When you zoom out to see whole continents, the distortion returns. Several online maps now switch to a 3D globe view at small scales, which avoids the problem entirely. For planning a route between two cities, the Mercator-style web map remains a very practical tool.
More Surprising Facts Hidden in the World Map
- The Pacific is bigger than all land combined. According to NOAA Ocean Exploration, the Pacific Ocean covers more area than all the continents put together. Browse our Pacific Ocean guides to see what lies across it.
- China uses a single time zone. Although the country spans roughly five time zones’ worth of longitude, all of China officially keeps Beijing time (UTC+8), so the sun rises very late in the far west.
- Antarctica is not a ribbon. On Mercator maps it looks like an endless strip, but it is a roughly circular continent of about 14 million square kilometers. Our Antarctica travel guide explains how to see it for yourself.
- North up is a convention. Nothing in physics puts north at the top; many medieval European maps placed east at the top instead.
How to See the True Size of Countries Yourself
You do not need a cartography degree to check a map. A few simple habits will give you a more accurate mental picture of the world:
- Use a globe, or the globe view in an online map, whenever you compare continents.
- Drag countries on a true-size tool. Interactive sites let you move a country’s outline toward the equator or the poles and watch its Mercator size change.
- Check the projection name printed in a map’s legend. Equal-area projections are the right choice for comparing sizes, population density or land use.
- Compare areas in numbers, not by eye. Official statistics in square kilometers settle most arguments quickly.
- Look at flight paths on a globe. Long-haul routes that look curved on a flat map are often the shortest path, a great-circle route over the sphere.
World Map Projections FAQ
Is the Mercator map wrong?
It is not wrong, but it is often used for the wrong purpose. The Mercator projection correctly preserves angles and local shapes, which made it ideal for sea navigation. It badly exaggerates the size of areas far from the equator, so it should not be used to compare the sizes of countries.
How much bigger is Africa than Greenland?
Africa covers about 30.4 million square kilometers and Greenland about 2.17 million, so Africa is roughly 14 times larger. On a Mercator map they look similar in size because Greenland sits at high latitude, where the projection stretches areas the most.
What is the most accurate world map?
No flat map is accurate in every way. For comparing sizes, use an equal-area projection such as Equal Earth, Mollweide or Gall–Peters. For a balanced general-purpose view, many atlases use the Winkel tripel or Robinson. Only a globe shows sizes, shapes and distances correctly at the same time.
Why do schools use the Mercator projection?
Mostly habit and familiarity. Mercator-style maps became standard wall maps in the nineteenth and twentieth centuries, and they are still common because the shapes look recognizable. Many schools and publishers now prefer equal-area or compromise projections, and Boston Public Schools switched to Gall–Peters in 2017.
Is Russia bigger than Pluto?
Not quite. Russia covers about 17.1 million square kilometers, while Pluto’s surface area is about 17.7 million square kilometers based on New Horizons measurements. The two are remarkably close, which is why the claim is so popular, but Pluto is slightly larger.
What projection does Google Maps use?
Google Maps, like Bing Maps and OpenStreetMap, uses Web Mercator, a variant of the Mercator projection. It keeps local shapes and angles correct when zoomed in to street level. When you zoom far out on a computer, Google Maps can switch to a 3D globe view instead.